PLEASE help me with these weather charts!
Asked by: amanda 5651 views General Aviation, Private Pilot, Student Pilot
I am ABSOLUTELY stuck on answering the questions below for the attached weather charts. PLEASE help :(
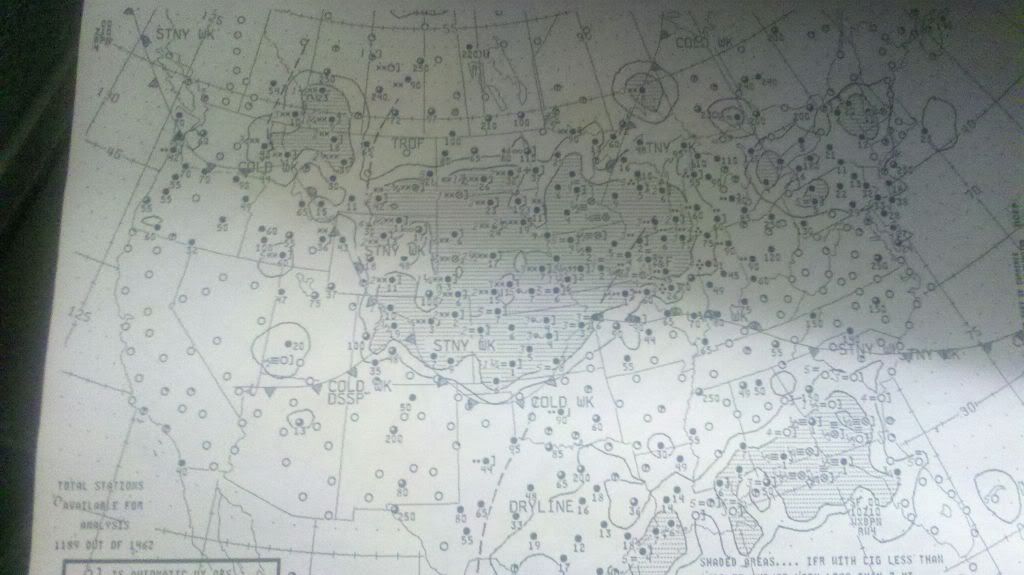
About what direction and speed is the wind blowing at the station in extreme southern Texas?
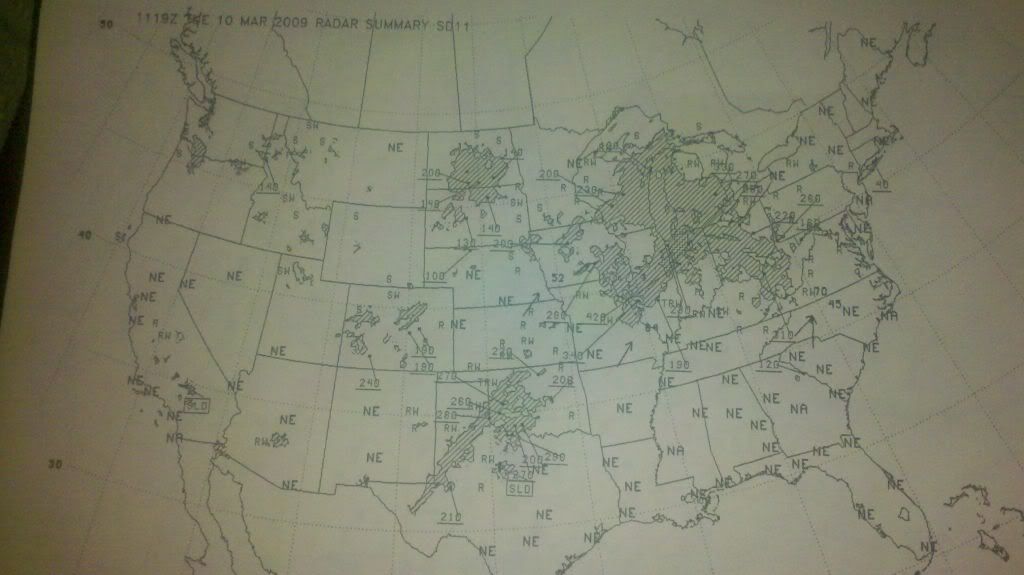
1. Using the other charts, which general direction is the Low pressure over Kansas going to move in the next several hours? Explain your answer.
2. Would you expect there to be gusty winds in Colorado? Why or why not?
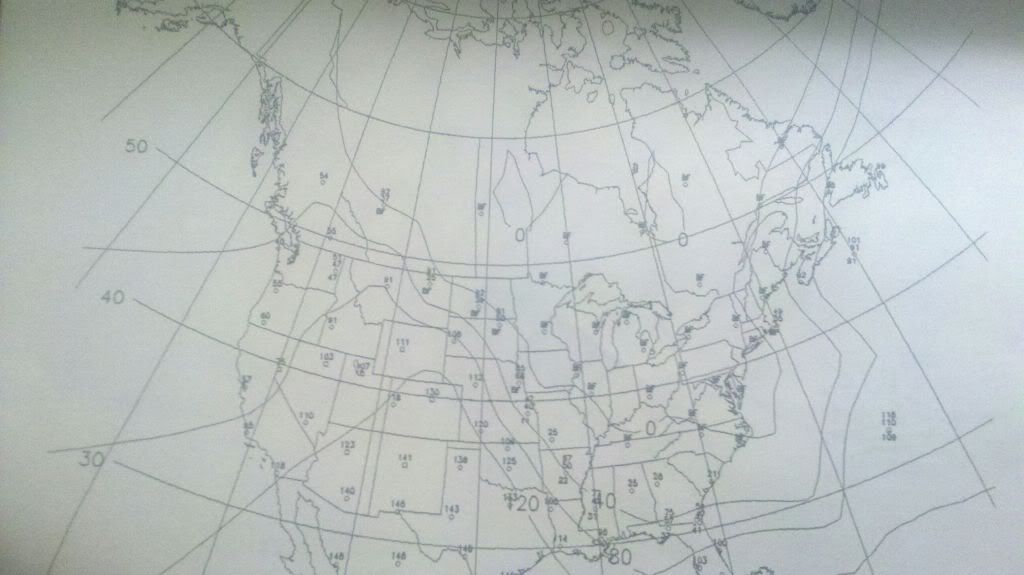
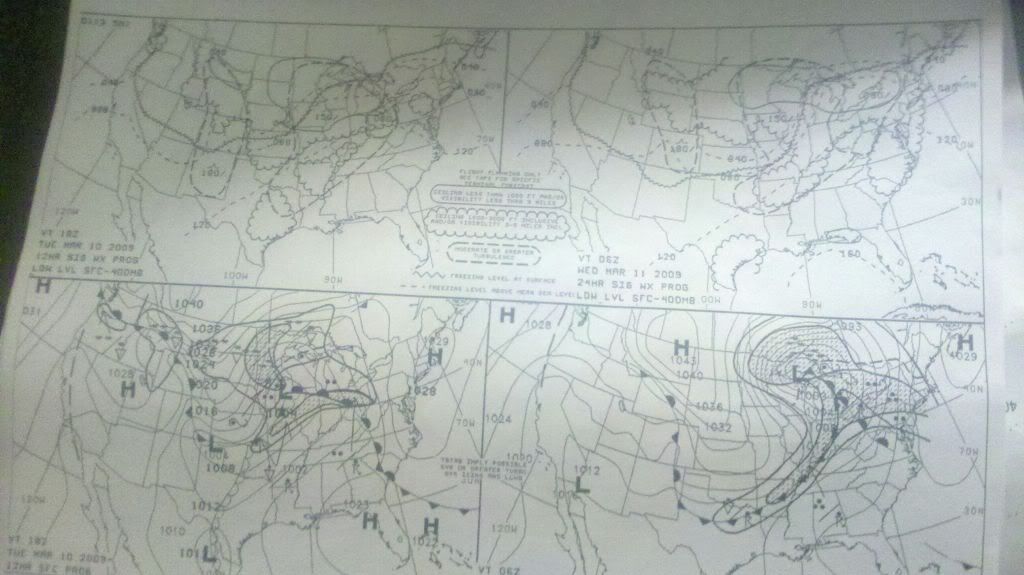
3. Approximately what altitude is the freezing level forecast to be during the 24 hour forecast for Southern IL?
4. Would you expect thunderstorms to happen in Southern Illinois during the forecast period? Why or why not?
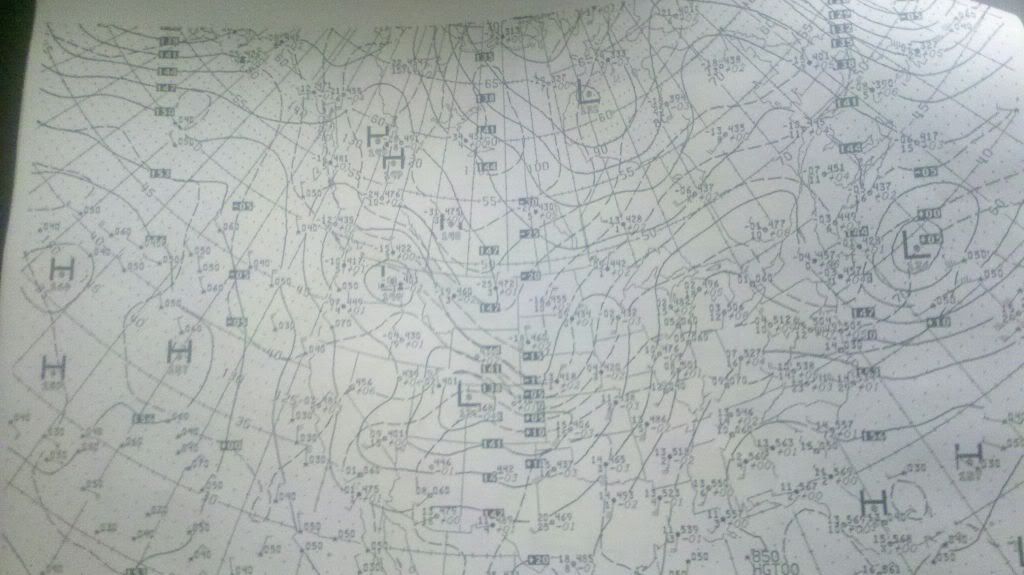
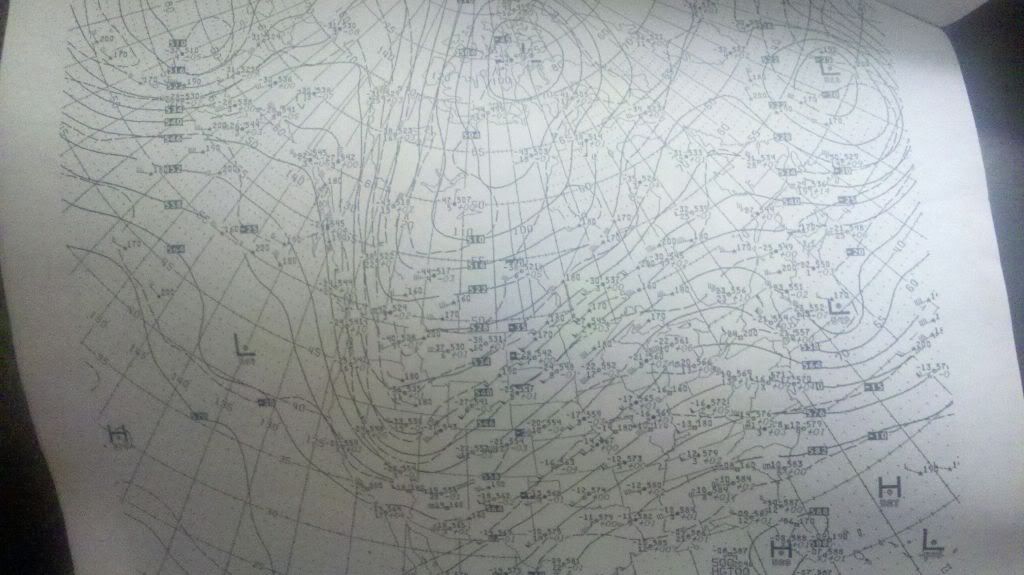
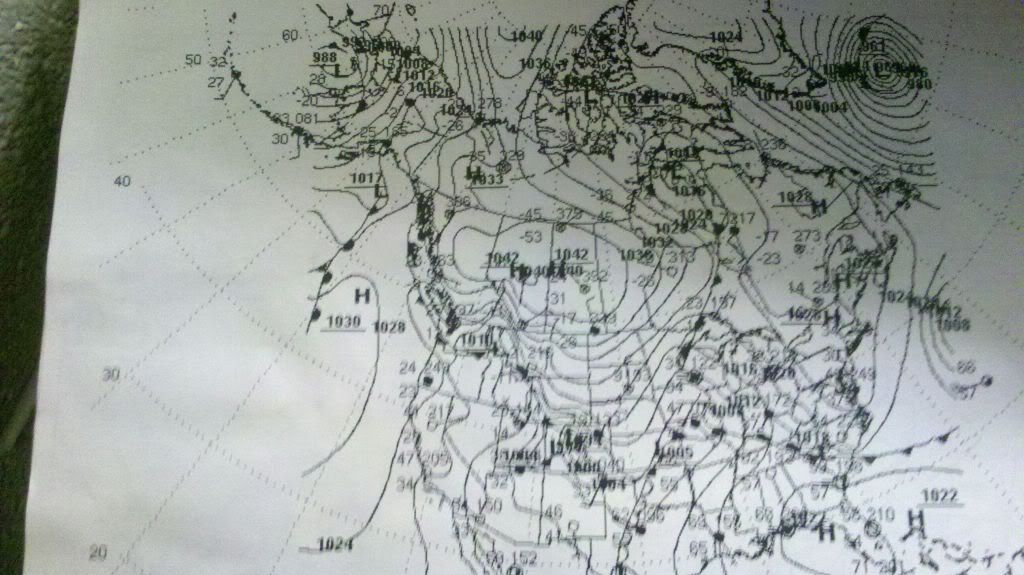
5. Do the H and L symbols correspond to the H and L symbols on the surface analysis chart? If so, how?
6. What is the difference between the stations with stars vs. squares vs. circles?
7. Why do we use the 850mB chart?
8. Why do we use the 500mB chart?
9. What is significant about the circles that are filled in vs. hollow circles in the station models?
10. For the two station models in SD, would you expect there to be clouds? Why or why not?
11. At about what altitude would you expect the freezing level in Central, IL (over KSPI)?
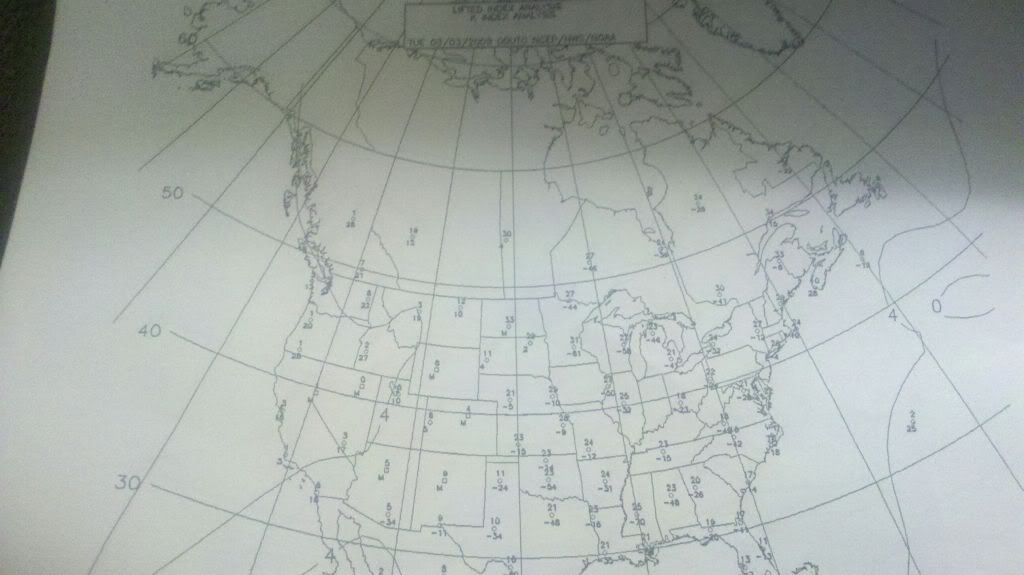
12. What is the lifted index? K index? What do each tell you?
13. Does this chart indicate where thunderstorms will be? Why or why not?
14. Does 7/-1 (depicted in Florida) indicate stable or non stable conditions?
15. Does what you see in this chart change your answer to question 5?


The following terms have been auto-detected the question above and any answers or discussion provided. Click on a term to see its definition from the Dauntless Aviation JargonBuster Glossary.